How to use Company Assessment Tools.
Note: This is an academic essay, not quite my usual style of writing!
This essay critically analyses four common company assessment tools and provides a simple yet effective methodology for choosing the right set of tools based on different situations.
Introduction.
Company assessment tools are frameworks that take different inputs to guide structured decision-making. They are essential because better decision-making leads to better organisational outcomes. They provide a clear answer to where, strategically, an organisation is right now. Ideally, they identify the current gaps and next steps required to reach a future vision of success.
This is useful in various situations, such as a manager embarking on a new project, a senior executive considering buying another organisation, and even a new MBA graduate considering joining a specific company. Different tools will be appropriate depending on the situation and data access.
This essay will critically analyse four tools. These are the 7-S Mckinsey Framework, Balanced Scorecard, SWOT, and PESTLE. The writer will review the merits and limitations of each tool and how multiple tools can be combined to create a more thorough analysis of an organisation.
Additionally, the writer will conclude with a framework for choosing which tools to use based on the type of problem. This is important because managers increasingly suffer from information overload in the modern world. (Hyde et al. 2004).
Also, there is an inverse correlation between the amount of information gathered and the quality of decision-making. Keller and Staelin (1987) demonstrated this in consumer behaviour. While consumer decisions are not equal to strategic management decisions, the inverse correlation between the amount of information gathered and the quality of decision-making is likely widely applicable to organisational management and decision-making, as argued by Iselin (1989).
Finally, company assessment tools may be better for our health! Better decisions lead to better outcomes, with fewer working hours required (Sparks et al., 2001).
Expanded Mckinsey 7-S Framework.
Introduction to the Expanded 7-S Mckinsey Framework.
The 7-S Framework was created in the 1980s by two partners at McKinsey, Tom Peters and Robert Waterman. It is used in change management and is widely adopted worldwide (Kocaoğlu and Demir, 2019). The framework has seven factors: strategy, structure, systems, style, staff, skills, and shared values, which are the core elements of an effective strategy (Weber, 1998).

The 7-S Framework is about asking the right questions.
The framework is implemented by reviewing each of the seven factors separately and asking critical questions to understand the current situation. Pravdic and Kucinar (2014) argue that many questions are broadly applicable regardless of the organization, so a “checklist approach” can be used when implementing the 7-S Framework. While this may be helpful, this writer believes crafting bespoke questions for each factor is the superior methodology — because just considering which questions to ask helps unveil key answers and connections between multiple factors.
Merits: 7-S Framework is beneficial for internal analysis.
It is an excellent tool for understanding core internal organisational factors, including “hard” factors such as Strategy, Structure, and Systems, as well as “soft” factors such as Style, Staff, Skills, and Shared Values. The framework best suits a broad analysis of the organisation’s internal workings to understand which key initiatives are worth pursuing. (Baishya, 2015)
Limitations: Internal focus and difficulty with metrics.
Criticisms of the 7-S Framework state that it only focuses on internal factors and does not consider external factors such as the competitive, economic, and political landscapes (Ravanfar, 2015). However, this limitation can be overcome by combining the 7-S framework with a more external focussed company assessment tool such as PESTLE (Okyere et al., 2020).
The other main criticism is that the “soft factors” are, in practice, difficult to pin down. Jack Welch, CEO of General Electric, is purported to have said, “figuring out the hard Ss is easy —it’s the soft Ss that are hard!” (Weber, 1998, p.13)
This is further corroborated by Pothiyadath and Wesley (2014, p.14), who state that “a prior review of literature indicates that no fit scale is available to measure the implementation of 7-S framework.”
Balanced Score Card.
Introduction to the Balanced Score Card.
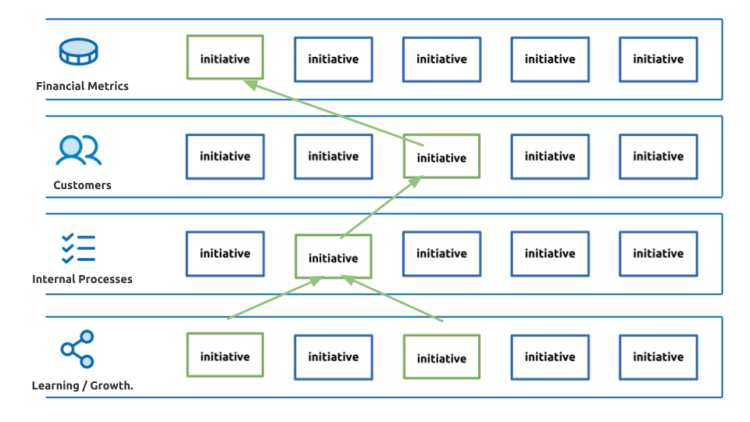
The BSC (Balanced Score Card) was developed in the 1990s by Robert Kaplan and David Norton to effectively measure organizational performance by providing a holistic view of an organization’s strategic objectives and how well they are being achieved. It focuses on four categories: learning/growth, internal processes, customers, and financial metrics. (Nørreklit, 2003)
Using BSC: creating a strategy map.
To use BSC, Kaplan and Norton (2004) suggest creating a Strategy Map that showcases the interplay of major initiatives — with a cause-and-effect chain from learning/growth to financial metrics. Then, set quantifiable metrics that can be constantly measured to track the impact and progress of each initiative. (Bento and Bento, 2013)
Merits: Complete view and real-time dashboards.
The BSC’s fundamental merit is its accurate, in-depth, comprehensive view of business performance. It provides the basis for continuous monitoring of business metrics, which is often singled out for financial stakeholders only. Because of the time-consuming nature and setup, the metric dashboards created tend to measure long-term performance, thus encouraging long-term strategies that generate value. (Awadallah and Allam, 2015)
Limitations: Time-consuming, requires resources and regular updates.
Collection of all this data is not simple and may require assistance from data experts and specific departments. Requires lots of resources and will need updates continuously unless real-time dashboards are created that can automatically update metrics as new data is gathered in the organisation.
There is also a tendency to use the BSC to evaluate managers instead of as a decision-making tool. It is problematic to evaluate managers on numerous unweighted metrics vs one single metric. (Kumar, 2012)
SWOT.
Introduction to the SWOT.
SWOT can test the Strengths, Weaknesses, Opportunities, and Threats of a business venture or project — thus the acronym. SWOT is generally credited to Albert Humphrey in the 1960s. However, Teoli, Sanvictores, and An (2021) claim that “this attribution remains debatable. There is no universally-accepted creator.”
The four evaluation quadrants subdivide into internal (Strengths and Weaknesses) and external (Opportunities and Threats). The organization can control the internal quadrants but not the external ones, as Gürel (2017) has argued.
How to Use SWOT.
To start, clarify the goal of the analysis, such as taking a specific action, strategy, or project. Make a list from most to least important, with a maximum of seven points per quadrant. This is within the typical working memory limit as per “Miller’s Law”. (Cowan, 2010)
Merits: SWOT is easy to use and understand and can be combined with other tools.
The crucial advantage of SWOT is that it is simple to understand and can quickly bring consensus amongst a diverse group of stakeholders (Yüksel, 2012).
According to Vlados and Chatzinikolaou (2019), SWOT is also straightforward to combine with other tools, especially PESTLE.
Limitations: SWOT may have bias problems due to self-reporting of weaknesses.
One of the most prominent criticisms of SWOT is that it does not use a metric-driven approach but relies on self-reporting, which can introduce a significant element of bias, especially concerning the Weakness Quadrant (Hill and Westbrook, 1997). This is backed up by related research in the World Development Report (World Bank, 2015).
This can be mitigated by gathering data from various sources and stakeholders or hiring external experts and consultants to undertake the analysis. (Nangia and Enderes, 2020)
PESTLE.
Introduction to the PESTLE
PESTLE is a tool that can be used to assess the external environment of a business. The acronym stands for Political, Economic, Social, Technological, Legal and Environmental. These factors can significantly impact an organization and should be considered when making decisions.
How to Use PESTLE
Create an analysis for each point in the acronym, identifying the opportunities and threats from the external environment. This may also be subdivided into short-term and long-term opportunities and threats, as well as by-product or functional areas (Shtal et al., 2018).
The tables below show examples of this type of analysis.

Merits: provides comprehensive situational awareness and links closely with SWOT.
The PESTLE structure enables a precise situational analysis of external factors that may affect the organization, which can easily be matched to the Opportunities and Threats quadrants in SWOT. (Widhiyaningrum et al., 2019).
Limitations: lack of internal analysis, which may cause management to be reactive.
PESTLE focuses on external factors. This means that solely using PESTLE analysis may lack internal focus and concentrate too much on macro vs micro factors. (Buye, 2021).
The writer believes this can lead management to take a reactive approach to decision-making. However, this can easily be mitigated by combining PESTLE with the other tools discussed above. (Okyere, 2018)
Conclusion.
All four company assessment tools reviewed in this essay are powerful tools for critically analysing organisational strategy. However, they are not all suitable for every situation, and it is often best to combine tools for a deeper analysis.
So the critical question is: which tool(s) to use?
This writer suggests a simple method to draw a matrix diagram between the amount of time/resources available and access to organizational data (which strongly correlates with working inside an organization).
Then, we can plot the four tools according to their requirements.

Based on this analysis, we can conclude with the following points:
- Where possible, combine multiple tools for a deeper analysis.
- Use the appropriate tools based on the amount of data, time, and general resources available per the matrix chart above.
List of References.
Awadallah, E. and Allam A. (2015) ‘A Critique of the Balanced Scorecard as a Performance Measurement Tool’, International Journal of Business and Social Science, Volume 6 Issue 7, p.95.
Baishya, B. (2015) ‘McKinsey 7s Framework in Corporate Planning and Policy’, International Journal of Interdisciplinary Research in Science Society and Culture, 1(1), pp. 166-167
Bento, A. and Bento, R. (2013) ‘Validating Cause-and-Effect Relationships in the Balanced Scorecard’, Academy of Accounting and Financial Studies Journal, 17(3)
Buye, R. (2021) Critical examination of the PESTEL Analysis Model. Available at: https://www.researchgate.net/publication/349506325_Critical_examination_of_the_PESTEL_Analysis_Model (Accessed: 12th October 2022)
Cowan, N. (2010) ‘The Magical Mystery Four: How is Working Memory Capacity Limited, and Why?’, Current Directions in Psychological Science, 19(1).
Gürel, E. (2017) ‘Swot Analysis: A Theoretical Review’, Journal of International Social Research, 4(19)
Hill, T., and Westbrook, R. (1997) ‘SWOT analysis: it’s time for a recall.’ Long Range Planning, 30(1), pp. 46-52.
Hyde et al. (2004) Making the Perfect Marketer Strategy+Business. Available at: http://strategy-business.com/press/16635507/04405 (Accessed: 12th October 2022)
Iselin, E. (1998) ‘The impact of information diversity on information overload effects in unstructured managerial decision making’, Journal of Information Science, 15(3), pp. 112-114
Kaplan, R.S. and Norton, D.P. ( 2004) Strategy Maps. Boston: Harvard Business School Press
Keller, K. and Staelin, R. (1987) ‘Effects of Quality and Quantity of Information on Decision Effectiveness’ Journal of Consumer Research, 14(2), pp. 200-213.
Kocaoğlu, B. and Demir, E. (2019) ‘The use of McKinsey s 7S framework as a strategic planning and economic assessment tool in the process of digital transformation’, Pressacademia, 9(9), pp. 114-115
Kumar, S. (2012) How Flawed is the Balanced Scorecard Construct? Available at: https://ssrn.com/abstract=1996657 (Accessed: 15th October 2022)
Nangia, N. and Enderes, K. (2020), Mitigating bias in performance management. Available at: https://www2.deloitte.com/content/dam/insights/us/articles/6644_Removing-bias-from-performance-mgmt/DI_Removing-bias-from-performance-mgmt.pdf (Accessed: 10th October 2022)
Nørreklit, H. (2003) The Balanced Scorecard: what is the score? A rhetorical analysis of the Balanced Scorecard. Available at: https://www.sciencedirect.com/science/article/abs/pii/S0361368202000971 (Accessed: 13th October 2022)
Okyere, B. (2018) Utilizing Mckinsey 7s Model, SWOT Analysis, PESTLE and Balance Scorecard to Foster Efficient Implementation of Organizational Strategy. Evidence from The Community Hospital Group-Ghana Limited. Available at: https://www.academia.edu/43419917/Utilizing_Mckinsey_7s_Model_SWOT_Analysis_PESTLE_and_Balance_Scorecard_to_Foster_Efficient_Implementation_of_Organizational_Strategy_Evidence_from_The_Community_Hospital_Group_Ghana_Limited (Accessed: 15th October 2022)
Pothiyadath, R. and Wesley, J. (2014) ‘Developing a Measurement Scale for 7-S Framework’, IOSR Journal of Business and Management, 16(1), p. 14.
Pravdic, P. and Kucinar, R. (2014) The Improvements of BSC Performances In 5 Ways. Available at: http://www.cqm.rs/2014/cd1/pdf/papers/focus_2/029.pdf (Accessed: 15th October 2022)
Ravanfar, M. (2015) ‘Analyzing Organizational Structure Based on 7s Model of Mckinsey’, Global Journal of Management and Business Research: A Administration and Management, 15(10)
Shtal, V. et al. (2018), “Methods of analysis of the external environment of business activities”, Revista Espacios, 39(12), pp. 22-24.
Sparks et al. (2001) ‘The effects of hours of work on health: A meta-analytic review’ in Managerial, Occupational and Organizational Stress Research. Edition 1. Routledge.
Teoli, D. and Sanvictores, T. and An, J. (2019), SWOT Analysis. Available at: https://europepmc.org/article/med/30725987#article-29790.r1 (Accessed: 15th October 2022)
Vlados, C. and Chatzinikolaou, D. (2019), ‘Towards a Restructuration of the Conventional SWOT Analysis’, Business and Management Studies, 5(2), pp. 76-84.
Weber, J. (1998). A Leaders’ Guide to Understanding Complex Organizations. Available at: https://ssrn.com/abstract=910746 (Accessed: 15th October 2022)
Widhiyaningrum et al. (2019), Combining SWOT and PESTLE Model to Assess Kaskus Business Model. Available at http://www.ieomsociety.org/ieom2019/papers/573.pdf (Accessed: 14th October 2022)
World Bank (2015), The Biases of Development Professionals. Available at: https://www.worldbank.org/content/dam/Worldbank/Publications/WDR/WDR%202015/Chapter-10.pdf (Accessed: 11th October 2022)
Yuksel, I. (2012), An Integrated Approach with Group Decision-Making for Strategy Selection in SWOT Analysis. Available at: https://www.researchgate.net/publication/282506020_An_Integrated_Approach_with_Group_Decision-Making_for_Strategy_Selection_in_SWOT_Analysis (Accessed: 15th October 2022)
